Census Chart Dashboard
A SvelteKit dashboard that turns U.S. Census data into charts and maps from plain TOML files. Drop a file into charts/ and it appears live — a toast announces it and it slides to the top of a newest-first sidebar, no restart.
All the Census ugliness (FIPS codes, variable codes, per-year fetches, geometry) is hidden behind the framework. A chart file only ever contains friendly aliases and place names — never a code.
Features
- TOML in, charts out. One declarative file per chart; the framework resolves, fetches, caches, and renders it.
- Live updates. A file watcher + SSE stream means adding/editing/removing a
charts/*.tomlupdates the UI instantly (toast on add, recompile on change, redirect on remove). - Five chart kinds —
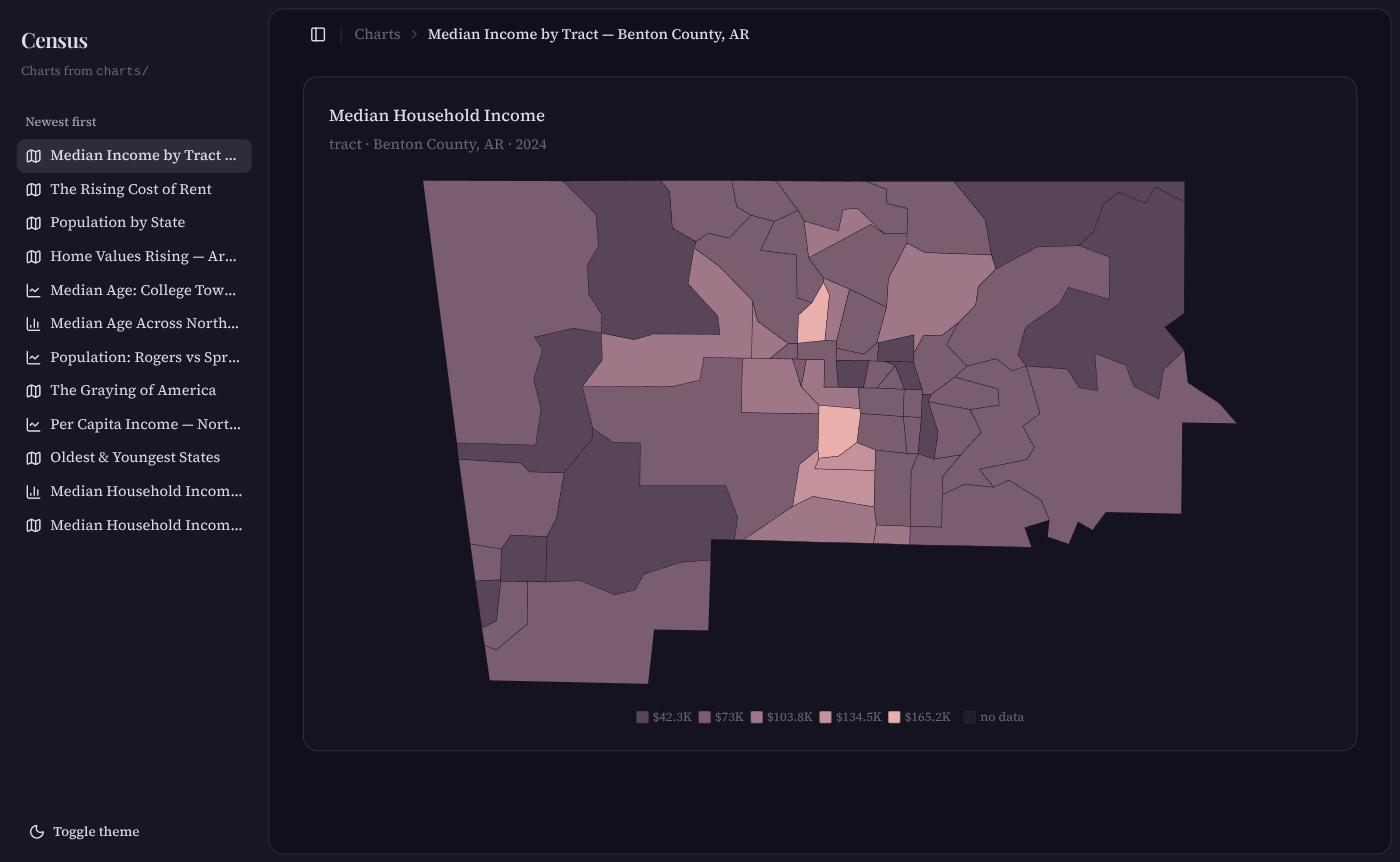
line,bar,area,scatter, andmap(choropleth). Single-year bars auto-render as a sorted horizontal ranking. - Maps at four levels — state, county, place, and tract. National maps use an Albers USA projection (AK/HI insets); smaller extents use a fitted projection.
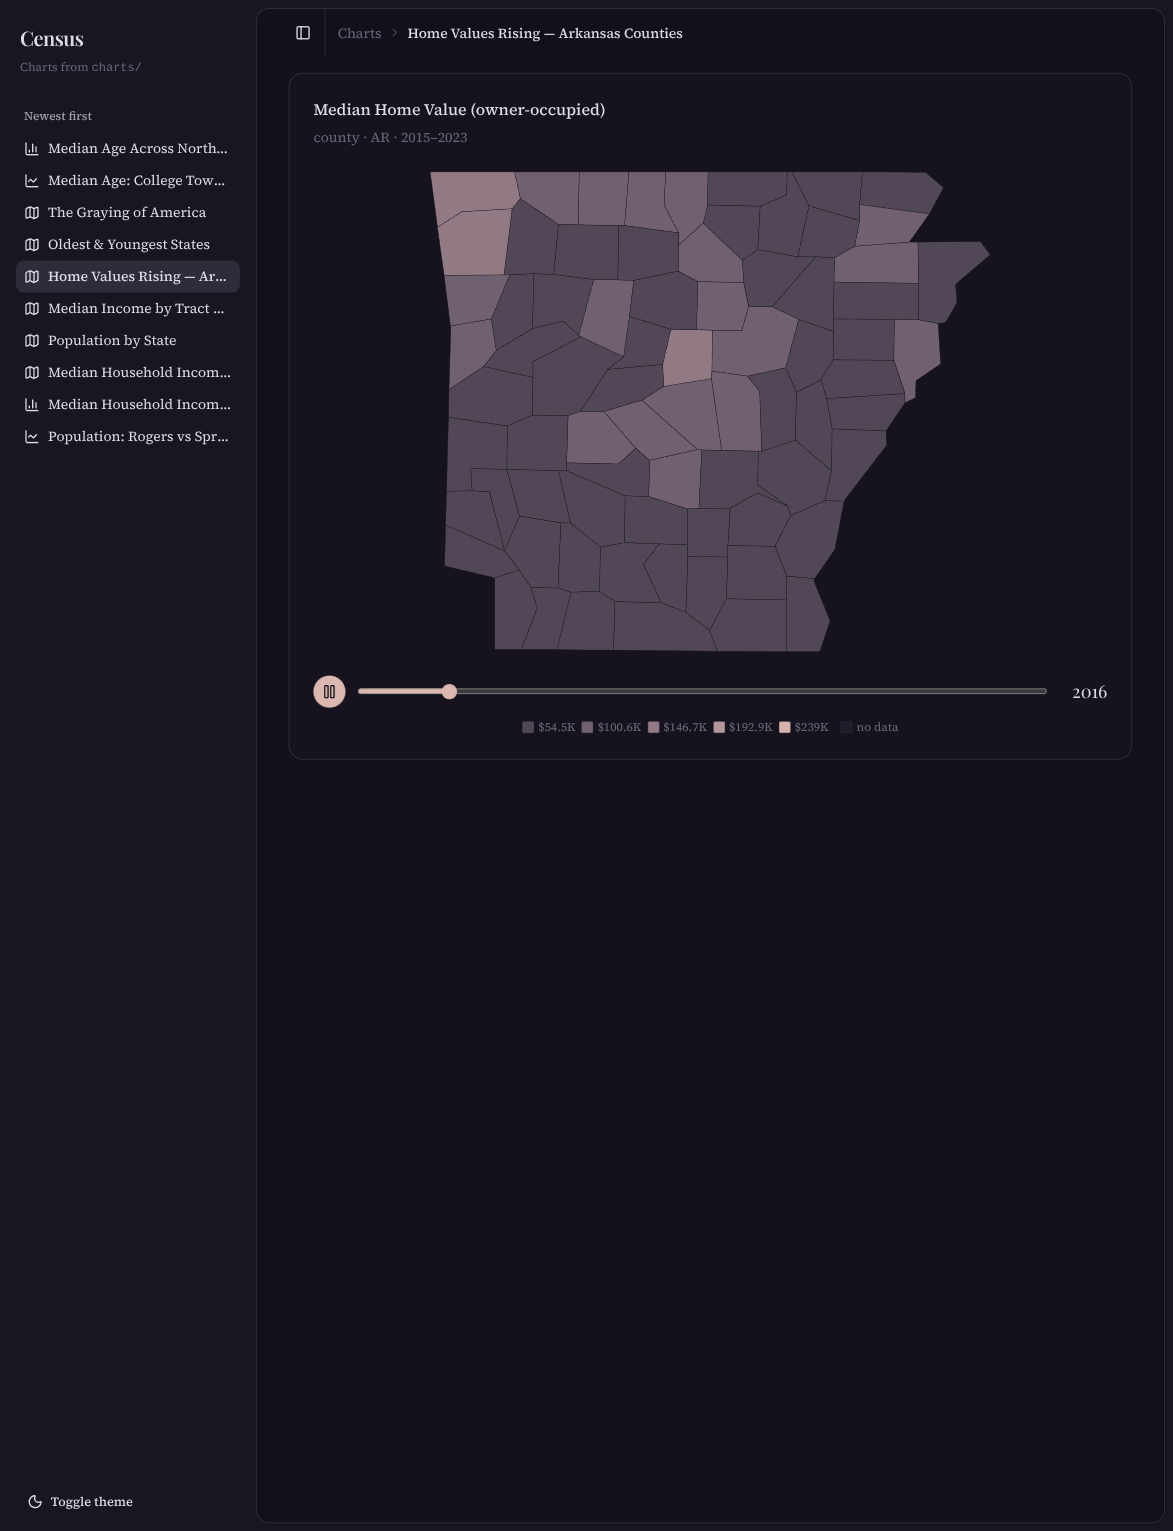
- Animated choropleths. Give a map a year range and it plays through one frame per year with a play/pause button and a draggable scrubber, over a fixed color scale.
- Offline, deterministic geo resolution. Friendly place names → GEOIDs via bundled Census Gazetteer files; ambiguous names fail with a candidate list instead of charting the wrong place.
- Immutable filesystem cache. Census vintage data never changes, so responses are cached forever under
.cache/. - An author CLI for a tight write → validate → build loop.
- Rosé Pine theme, light/dark, with a theme-reactive color ramp so maps read correctly in both.
Quick start
bun install
cp .env.example .env                  # then paste your Census API key
bun scripts/fetch-gazetteer.ts        # geography lookup data (one-time)
bun scripts/fetch-geometry.ts state   # map boundaries (one-time, per level)
bun scripts/fetch-geometry.ts county
bun run dev
A free Census API key is required — the data endpoints redirect anonymous requests to an HTML page. Grab one at https://api.census.gov/data/key_signup.html.
The gazetteer and geometry files are downloaded by the scripts (not committed). For place/tract maps, fetch the relevant state too, e.g. bun scripts/fetch-geometry.ts place AR.
Authoring a chart
[chart]
title = "Population: Rogers vs Springdale, AR"
kind = "line"                 # line | bar | area | scatter

[query]
metric = "population"         # alias from registry/metrics.toml
dataset = "acs5"              # acs5 | acs1   (decennial deferred)
years = "2010..2023"          # range "a..b" OR a list [2010, 2015, 2020]

[[series]]
place = "Rogers, AR"          # friendly "Name, ST", resolved offline

[[series]]
place = "Springdale, AR"
id defaults to the filename slug. Each series label defaults to the resolved place name.
Authoring a map (choropleth)
Maps shade many geographies by one metric:
[chart]
title = "Median Household Income by County, Arkansas"
kind = "map"

[query]
metric = "median_household_income"
dataset = "acs5"
year = 2023                   # a single year…

[map]
level = "county"             # state | county | place | tract
within = "AR"                # "US" | a state ("AR") | a county ("Benton County, AR")
Animate it by swapping the single year for a years range:
[query]
years = "2015..2023"          # …or a range → one frame per year, play/pause + scrub
Valid level × within: state+US; county+US/state; place+state; tract+county.
CLI (bun cli/census.ts <command>)
| command | what it does |
|---|---|
validate <file> |
parse + resolve aliases/geographies + coverage checks |
resolve "<place>" |
print the resolved GEOID + gazetteer details |
metrics |
list registry aliases and the datasets each supports |
build <file> |
run the full pipeline, write tidy JSON to .cache/charts/{id}.json |
new <slug> |
scaffold a skeleton TOML in charts/ |
Ambiguous or unknown place names fail validation with a candidate list rather than charting the wrong place.
How it works
charts/                 watched TOML chart specs (the content)
registry/metrics.toml   curated alias -> Census variable code, per dataset
registry/gazetteer/     Census Gazetteer flat files (offline place/county geo)*
registry/geometry/      TIGER boundary TopoJSON, keyed by GEOID, for maps*
src/lib/census/         schema · registry · geography · geometry · client · compile · types
src/lib/components/      ChartView (series) + MapView (choropleth)
src/lib/server/          charts catalog + fs watcher
src/routes/              sidebar shell · chart pages · /api/charts (+ SSE stream)
cli/census.ts            author toolkit
scripts/                 fetch-gazetteer · fetch-geometry
                         (* downloaded by the scripts, git-ignored)
The pipeline: parse (zod) → resolve (alias → variable code, place → GEOID) → fetch (cached Census API calls) → compile (tidy data / joined geometry + a render-ready payload) → render (LayerChart).
Quality
bun run check    # svelte-check (types)
bun run test     # vitest (schema / geography / compile units)
bun run lint # prettierTech
Bun · SvelteKit + Svelte 5 runes · Tailwind v4 · shadcn-svelte · LayerChart · d3-geo · smol-toml · zod. Geo data from the U.S. Census Bureau (Gazetteer + TIGER).
License
MIT